|
Address: Laboratory of Cellular and Developmental Biology, National Institute of Diabetes and Digestive and Kidney Diseases, National Institutes of Health, Bethesda, MD 20892, USA. Correspondence: Brian Oliver. E-mail: oliver@helix.nih.gov @ 2002 BioMed Central Ltd ISSN 147S-4924
Abstract Reductionist approaches have been a tremendous boon to understanding the regulation of transcription, one of the vital steps defined by the central dogma of molecular biology. Gene-by-gene analysis has clearly shown that control regions within the DNA sequence bind protein transcription factors that up- or down-regulate the activity of promoters. But now that patterns of gene expression can be studied across the entire genome, new findings suggest that, as well as being controlled individually, genes may also be subject to regulation according to their location within the genome. It has been clear for some time that genomic location has some impact on gene expression. For example, in various species when transgenes are removed from their local environment and reinserted elsewhere in tlhe genome the transgenes tend to work more-or-less normally but almost always show some alteration in expression due to insertion site -and sometimes the effect on expression is dramatic. That even subtle differences in gene expression can have consequences in some circumstances is also well known, and is illustrated by the dramatic effects of minute concentration differences in the gradients of pattern-determining morphogens during development [1], and in the dosage compensation mechanisms that have evolved to ensure that X-Iinked genes are expressed at similar levels in male and female animals [2]. In this issue, Spellman and Rubin [3] describe a transcriptional profiling study that reveals a surprising correlation between the organization of genes along Drosophila chromosomes and their expression levels. Specifically, neighborhoods composed of an average of 15 contiguous genes show markedly similar relative expression levels. Although the average neighborhood contains 15 genes, there is a very wide range. These neighborhoods are not obviously composed of genes with related functions that might be expected to exhibit co-regulation, as is the case for the rRNA, histone, Hox, and globin gene clusters. Two other recent papers also suggest that genes with similar expression levels are non-randomly distributed, in this case within the human genome [4,5]. In humans, it has been suggested recently that expression neighborhoods serve to regulate housekeeping functions [5]. In Drosophila this is less likely, however, because Spellman and Rubin [3] demonstrate that embryos and adults differ dramatically in the organization of their neighborhoods of similarly expressed genes (although one could argue about whether the vermiform Drosophila larvae and adults might be expected to show two different housekeeping gene sets). The compelling and intriguing Drosophila data are rather mysterious and warrant closer examination: what could underlie the observed similarity of gene expression within neighborhoods? Perhaps the simplest explanation is that co-regulation within an expression neighborhood may be due to incidental interactions between promoters and transcriptional enhancers (Figure la). In this model, transcription of one or more genes in a genomic cluster is regulated by the usual suspects (transcription factors) binding at the appropriate sites and activating nearby genes as well as the target gene -and the resulting inappropriate expression of genes other than the target is tolerated because it has little biological effect. If this is the case then, if sites that bind strong transcriptional activators, such as the yeast protein GAl4, were seeded in the Drosophila genome they should create new neighborhoods. Transcription factors have a limited range of effect [6], so if strong activators are responsible one might expect to see a steep fall-off in the effects of a given factor with distance from its core binding site (Figure la). But the data presented by Spellman and Rubin [3] suggest that in fact the pattern of gene expression within a neighborhood is essentially a 'square wave' (as shown in Figure lb). Spellman and Rubin [3] therefore favor a structural chromatin domain model (Figure lb ), involving the opening of the chromatin of an entire neighborhood as a result of activation of a target gene within the neighborhood. The creation of a domain of open chromatin structure would, it is argued [3], increase the availability of the promoters and enhancers of all the genes in the neighborhood to the transcriptional machinery, leading to correlated increases in expression. Such a domain could be delimited by boundary elements or insulators, accounting for the square wave profile (Figure lb). A problem with this model is that increased chromatin accessibility is just as likely to facilitate the binding of repressors as activators, with the result that some genes would be up-regulated and some down-regulated. This is not consistent with neighborhoods of co-regulation. But if increased accessibility primarily affects basal (that is, non-activated) expression, there could be a general increase in transcription of all the genes in the neighborhood. Indeed, modification of the chromatin of the male X chromosome in Drosophila results in global up-regulation of gene expression [2], as does depleting histones from yeast [7]. And if neighborhoods influence all genes within them and not just those that evolved so as to be regulated within a particular neighborhood -then inserted transgenes that land in a neighborhood should come under neighborhood control, and chromosome deletions and inversions should alter the extent of particular neighborhoods.
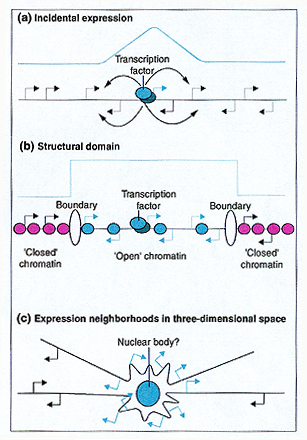
Figure I
Models to account for gene expression neighborhoods. Several models(or combinations of models) could account for the observed phenomenon of gene expression neighborhoods. (a) Incidental regulation. A transcription factor (green oval) binds at a target gene (green arrow) and incidentally up-regulates neighboring genes. In this model. the level of expression of neighboring genes is determined by proximity to the target gene and is expected to decrease with distance from the target gene (the green line at the top of each panel indicates the gene expression profile across the neighborhood). (b) A structural domain model. A discrete 'open' chromatin domain is created as a result of activation of a target gene within the domain. Flanking boundary or insulator elements (yellow ovals) define the neighborhood and the limits of the open chromatin domain. (Note the 'square wave' expression profile.) (c) Expression neighborhoods in three-dimensional space. In this model, activation of a target gene results in its recruitment to a specific nuclear location. This would necessarily involve the co-recruitment of neighboring genes. The particular subnuclear location exposes the neighborhood to increased concentrations of components of the transcriptional machinery (the image shows two segments of chromatin with two neighborhoods in the vicinity of a (green) nuclear body).
References |